
Giving a ‘voice’ to local context by focusing on quantitative measures of neighborhood trends can help foster collaborative solutions by residents, elected officials, government agencies and other multi-sector stakeholders in order to improve the quality of life in every neighborhood. At the Baltimore Neighborhood Indicators Alliance, our research has shown that we must address and eliminate the disparities among the neighborhood conditions themselves for a more equitable and just city overall.
In the wake of the civil unrest that occurred in Baltimore in 2015, there is a critical urgency to ensure that our actions not only remove barriers for people, but also the promote equity across all neighborhoods by focusing on three key goals. We have previously written about the first goal on housing diversity and affordability. This blog focuses on the second goal for greater accessibility, particularly in terms of access to work for everyone in every neighborhood.
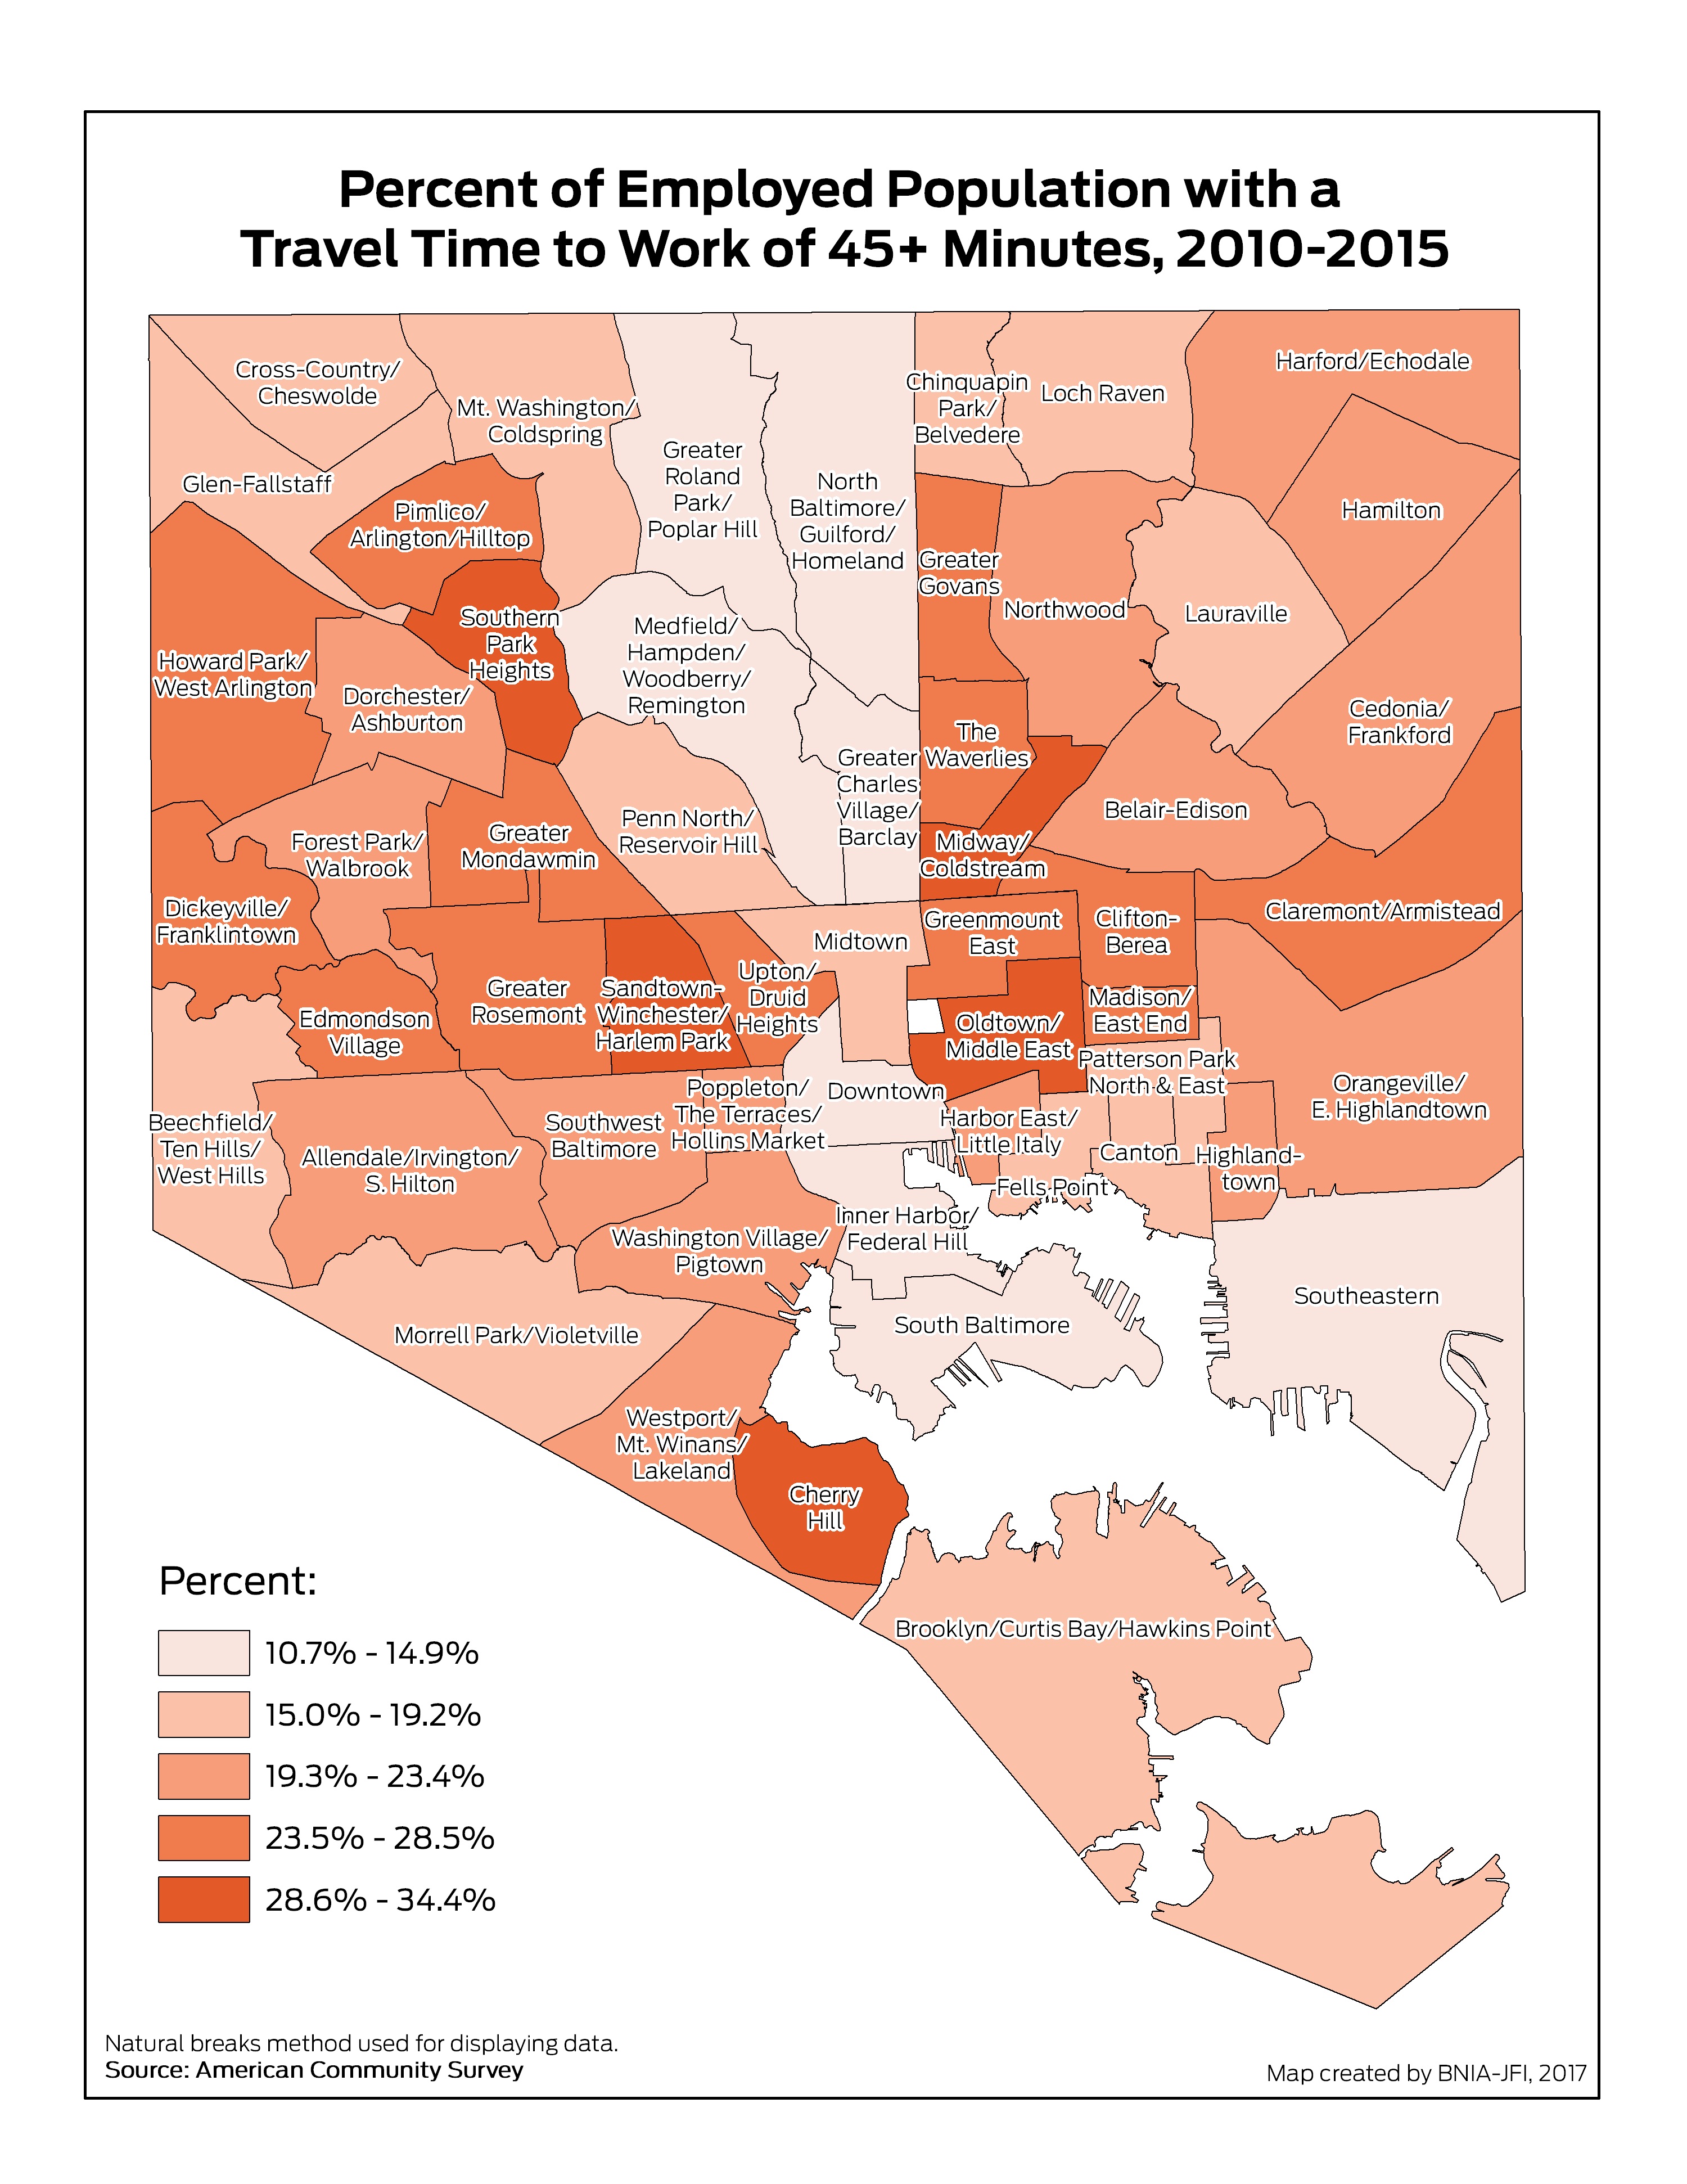
The percent of commuters in a neighborhood traveling more than 45 minutes to get to work has the strongest association with population decline for a neighborhood. The Community Statistical Areas (CSAs) in Baltimore with the highest percent of people traveling more than 45 minutes to work in 2015 were Sandtown-Winchester/Harlem Park (34.4%), Midway/Coldstream (33.7%), Southern Park Heights (31.1%), and Oldtown/Middle East (29.1%)1. Longer commutes can be a barrier to reliably getting to work on time2 particular when relying on public transportation. These CSAs are also the same ones with the highest percent of residents who use public transportation to get to work: Sandtown-Winchester/Harlem Park (46.1%), Greenmount East (39.3%), Upton/Druid Heights (38.7%), and Oldtown/Middle East (34.8%)3.

The impact on urban neighborhoods of long commute times is two-fold. Chances are high for an employed resident to move closer to a job more than 45 minutes away, as the negative correlation to population growth implies; conversely, chances are high for a worker to not keep a job and become unemployed. Many of the same neighborhoods with long commute times have some of the city’s highest unemployment rates as well. Neither outcome contributes to the quality of life in the neighborhood itself.
And the trends by neighborhood are only exacerbating the disparities. Table 1 below shows that the percentage of households traveling more than 45 minutes to work has increased between 2006-2010 and 2011-2015 for the city as a whole from 19% to 20.4%. But percentage in neighborhoods like Downtown is decreasing, while the percentage in our highest commute time CSA (Sandtown-Winchester/Harlem Park) is actually increasing from 30.1% to 34.4% over the same time period.
Table 1: Change in Percent Traveling more than 45 Minutes to Get to Work |
|||
|---|---|---|---|
| Community | 2006-2010 | 2011-2015 | Change |
| Downtown/Seton Hill | 11.4 | 10.7 | -0.7 |
| Sandtown-Winchester/Harlem Park | 30.1 | 34.4 | +4.3 |
| Baltimore City | 19.0 | 20.4 | +1.4 |
All neighborhoods in the Baltimore region are impacted by the complex dynamics of people and businesses choosing to locate anywhere in order to have access to regional amenities. For a neighborhood to “compete” for new residents and jobs in the regional context, it must have locational advantages that meet the needs of people living there. In our increasingly interconnected region, that advantage may not mean that every neighborhood has to have all amenities, but rather everyone living in any neighborhood should be able to access amenities that may be located anywhere in the region, like a job or shopping centers or transportation hubs. Accessibility for everyone in every neighborhood is the key to regional equity in the 21st century.
Regional Equity
Achieving regional equity means considering both people and place. A competitive and inclusive region is one in which members of all racial, ethnic and income groups have opportunities to live and work in all parts of the region…and are included in mainstream regional life. It is also one in which all neighborhoods are supported to be vibrant places with choices for affordable housing…decent transit that connects people to jobs and healthy, sustainable environments
~Conversation on Regional Equity, 2006, Edging toward Equity: Creating Shared Opportunity in America’s Regions. Santa Cruz: University of California, Center for Justice, Tolerance and Community
Based on this research, the overall goal is to reduce the percentage of households traveling more than 45 minutes to get to work in all neighborhoods. One of the key ways that people access different parts of the region is via the transportation and transit network. Right now, in Baltimore, without a robust transit system, public transit is not an accessibility feature particularly for the neighborhoods in the western parts of the city.
If we think about our neighborhoods like the ‘muscles’ of our region, the transit and transportation system are like our ‘arteries’. We need better transit and mobility choices that help circulate everyone into and out of all of our neighborhoods, otherwise the places where we live will atrophy. By focusing investments to improve The Five Basics of good transit (Access, Reliability, Speed, Frequency, and Walkability), we can measurably improve the transit system and reduce the number of people who struggle with long commutes.
The Key Recommendations to Reduce High-Commute Times for Baltimore Neighborhoods:
1. Invest in high-quality transit service that measurably improves access to jobs in neighborhoods with long commute times
2. Ensure that workforce training programs targeting high unemployment neighborhoods focus on connecting people to proximate jobs (i.e. jobs within 45 minutes of the neighborhood)
3. Improve the quality of life in high-commute neighborhoods so that more households will choose to move in and more jobs become available within the neighborhoods themselves
1. Percent of Employed Population with Travel Time to Work of 45 Minutes and Over
2. Central Maryland Transportation Alliance (2014) “The Last Mile Final Report”
3. Percent of Population that Uses Public Transportation to Get to Work