
 With every new edition of Vital Signs, BNIA-JFI creates downloadable maps of every indicator. Explore the maps by chapter below.
Census Demographics
Housing and Community Development
Children and Family Health and Well Being
Crime and Safety
Workforce and Economic Development
Arts & Culture
Education and Youth
Sustainability
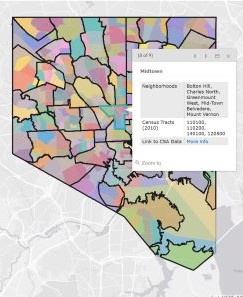
Curious about how communities relate to neighborhoods? Or what neighborhoods are in certain zip codes?
Click to launch BNIA’s interactive map which shows CSAs,neighborhoods, Census tracts, and zip codes.
Need a quick map of Community Statistical Areas or neighborhoods? Explore our downloadable maps below.
Community Statistical Area (CSA) Reference Maps
Community Statistical Areas (CSAs) and their Associated Neighborhoods
Community Statistical Areas (2010)
Community Statistical Areas and Census Tracts (2010)
Community Statistical Areas and Zip Codes (2010)
Community Statistical Areas and City Council Districts (2011)
Community Statistical Areas (2000-2009)
Community Statistical Areas and Census Tracts (2000-2009)