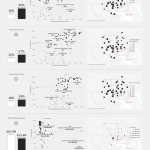
The White L vs. the Black Butterfly | Lawrence Brown
By Omar Abbasi | Action Analytics
I took the time to highlight the work of Dr. Lawrence Brown (The White L vs. The Black Butterfly) using Tableau Public
Twitter: https://twitter.com/omarabbasi1
Linkedin: https://www.linkedin.com/in/omar-abbasi/
#MICADAV Systems of Org Final Project
Data Source: Baltimore Neighborhood Indicators Alliance
Published: Mar 10, 2021Updated: Jul 30, 2021
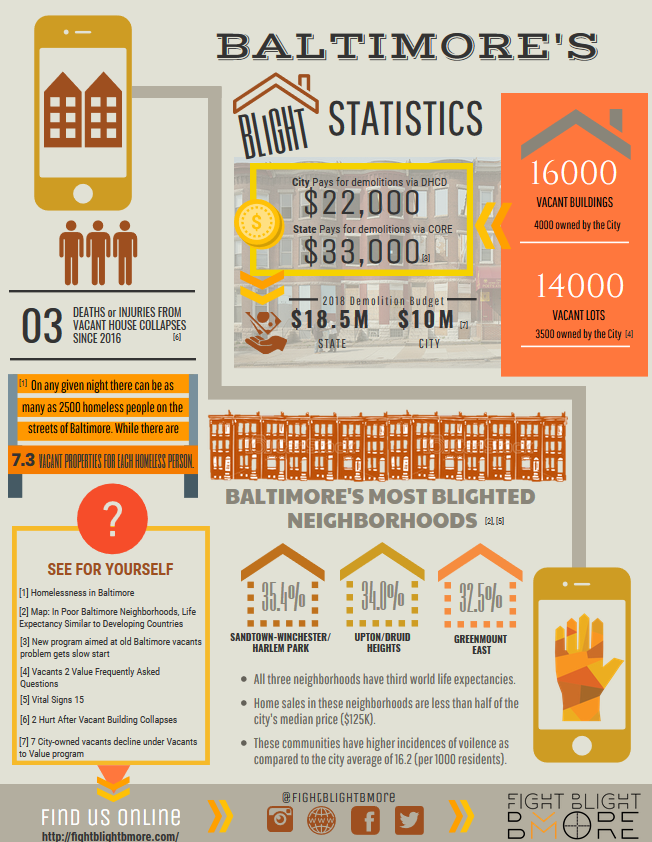
Fight Blight Bmore: In Brief
On Mother’s Day 2016, I witnessed what could have been an awful tragedy. A few children were riding their bikes down the sidewalk of Fremont Avenue, crossing Lafayette Street, where four brownstones were being demolished. The site was filled with debris, gaping holes about six feet deep, and had no gate to prevent site access. I witnessed the potential danger of these unsafe conditions such as a child falling into unsecured debris.
Since that day, I began researching, documenting, reporting, and tracking environmental hazards created by demolition sites around the city and the structures that preceded them. The hazards observed at that demolition site represented an instance of blight. Due to resident flight from American cities like Baltimore, fueled in part by racism, beginning in the 1960’s to surrounding counties, neighborhoods lost population as well as businesses, community institutions, and places of employment. These factors in concert with the post-industrial economic downturn of the 1970’s and the epidemic abuse of illicit drugs in the 1980’s resulted in numerous abandoned, improperly used, unkempt and/or underutilized properties commonly referred to as blight.
People living in neighborhoods with blight are not only losing access to home equity, community history and public sector improvements, they are also being exposed to community based trauma resulting in long term stress from fear of unsafe property implosion, toxic exposure, and crime. In terms of economic impact “each abandoned property costs its neighbors $70,000 in loss as it sits vacant,” according to Aaron Klein’s research. It is estimated that ..”more than 30 million housing units in the United States have significant physical or health hazards, such as dilapidated structures, poor heating, damaged plumbing, gas leaks, or lead.”(Urban Blight and Public Health, 2017). Using these numbers the economic impact of blight just in terms of lost home equity is over a billion dollars.
As I began identifying, documenting and reporting blight, I discovered that there was no unified self-service application to keep track of the blight and dangerous demolition conditions.. It became a major challenge keeping up with reports of blight just within in my neighborhood. Fight Blight Bmore (FBB) was born as a call to action to address blight and the issues is causes for individuals and communities. It will provide a tool for more effective and efficient management of data and reports of blight. FBB is an environmental and social justice initiative.
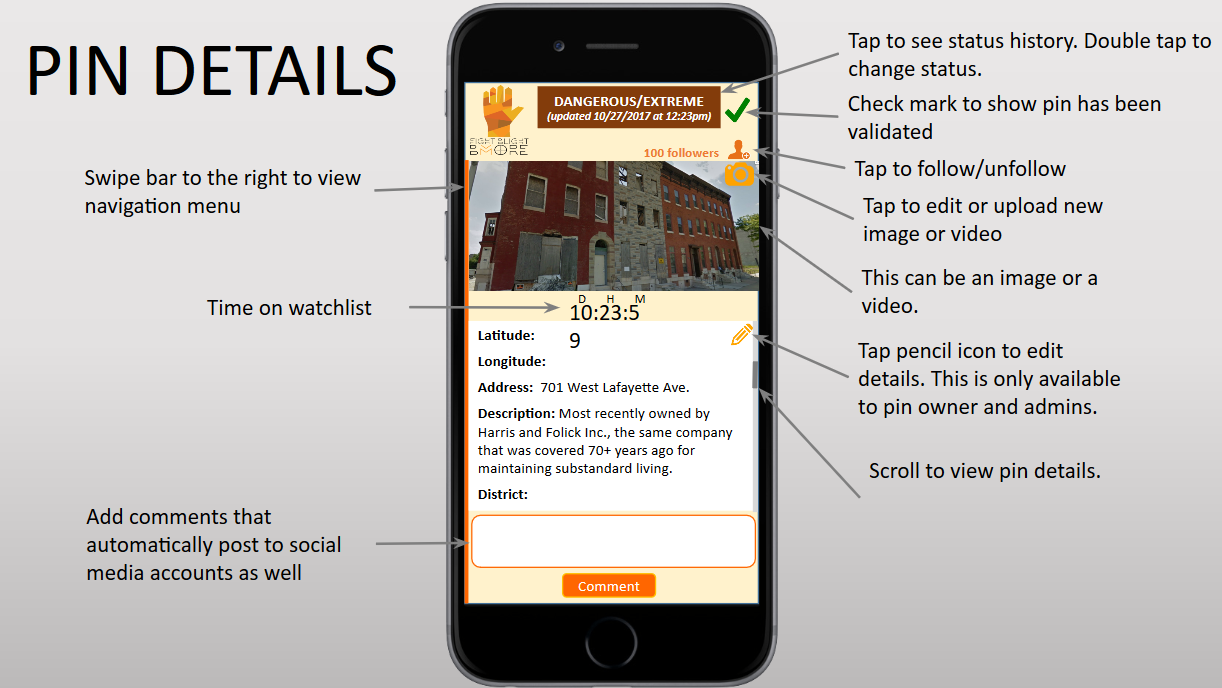
The first part of this initiative is a mobile software application (i.e., App). The aim of the App is to provide end users with a tool to identify, report and track blighted properties with the option to analyze collected and connected data sets. The basic functionality of the App would allow the end user to tag visible hazard(s) on a picture taken from a mobile device; assess the level of blight utilizing a customized rating scale and pin the blighted site using geolocation utilities. Additionally, the end user(s) will have the capability to report the identified blight to responsible parties from within the tool. The App will allow to follow report(s) of blight; view blight and related data; and utilize a variety of analytical tools on those data sets. There will be a gamification aspect to the tool, that encourages users to walk the neighborhood, communicate with neighbors and share personal narratives about property history. FBB is unique because it will bring together original crowd sourced data with existing municipal (ex. 311, Open Baltimore, SDAT) and private (ex. BNIA, BOLD, MRIS) data sources to create information to positively impact blight remediation. The second part of FBB is a community education which will provide information to residents and community groups on what blight is and how it impacts people, neighborhoods and cities health and economic wellness. The educational initiative is happening through group dialogues, videos, presentations, papers and infographics shared via social media which will be included within the applications as tips.