
By Ruth Robinson and Priya Kanneboyina
With the stay at home orders issued at the beginning of the novel Covid-19 pandemic, the ability to navigate the web and make video calls have become an essential function for nearly every household in Baltimore City and the rest of America. Access to ‘fast enough’ internet speeds has become synonymous with access to quality education for our children and the ability to work from home during this pandemic. With this in mind, our Data Science team wanted to try and answer two key questions:
- Is Baltimore City getting ‘fast enough’ internet speeds?
- Is our city’s internet speed up to par with the rest of Maryland?
Unfortunately, the answer to these questions point to continued disparities in distressed communities.
What is ‘fast enough’?
When referring to download speeds as a representation of overall internet speed, the Federal Communications Commission (FFC) categorizes internet speed into three categories based on Megabits per second (Mbps),
Basic Service = 3 to 8 Mbps;
Medium Service = 12 to 25 Mbps;
and Advanced Service = More than 25 Mbps
Here are the FCC’s guidelines on the type of service necessary for a household based on their daily usage and the amount of users that simultaneously use the service:
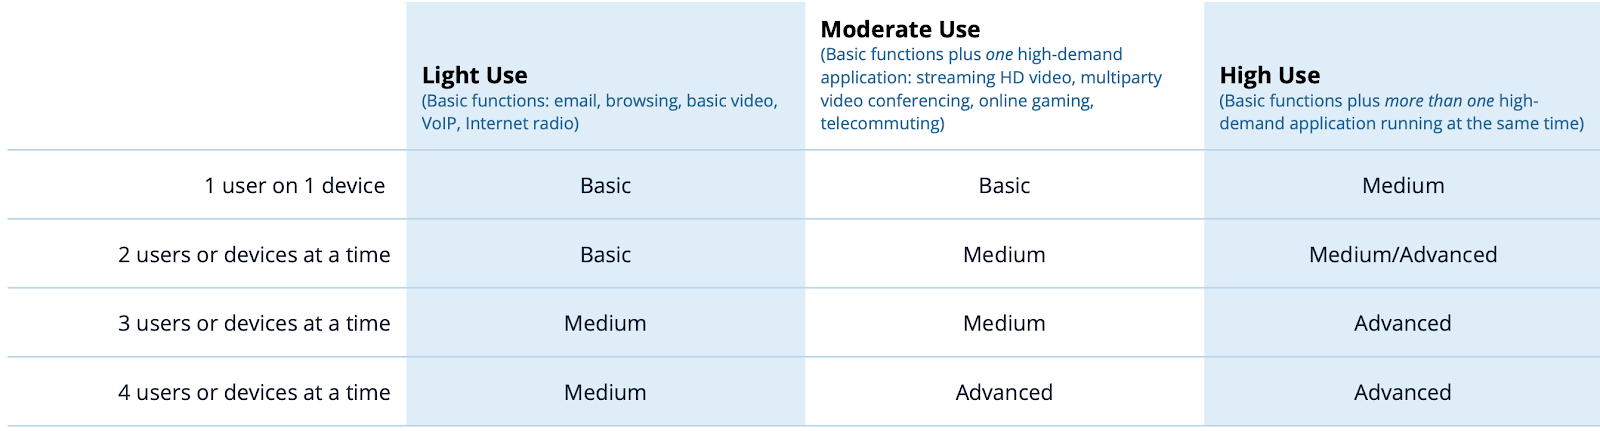
Source: https://www.fcc.gov/consumers/guides/broadband-speed-guide
Between working from home and going to school through whole- classroom video calls, it is reasonable to say that if there are at least two people using an internet service plan, 25 Mbps is just on the cusp of ‘fast enough’.
How to extract internet speed data for Baltimore City Using Measurement Lab
One of the largest collections of open source internet performance data are from the measurement lab (M-Lab), a “consortium of research, industry, and public- interest partners” dedicated to collecting quality data on a global level. The internet performance data, or ‘speed tests’, include a voluntary collection of upload and download speeds of a person’s internet source, the longitude and latitude of their internet source (typically a nearby cell tower), and other internet speed indicators. It must be understood that internet speed data will always have some level of geographic inaccuracy due to the location of where the users may take a speed test in relation to the location of the corresponding cell tower. The data from any given speed test will only reflect the internet speed of the nearest cell tower, which may very likely be in a neighboring community or town. Nonetheless, speed test data can be very useful when measured on the city level as opposed to a community level.
To extract just Baltimore City internet speed tests from such a large collection, we used the system GoogleBigQuery. This system uses the programming language SQL to assist the user in viewing specific parts of a large data set through ‘querying’ the data. The data from M-lab was collected in a way that grouped Baltimore City and Baltimore County under the name “Baltimore”. To isolate just Baltimore city, we used the Baltimore City shapefile which is a geographic information file-type that gives the longitude and latitudinal points of the perimeter of an area. When these points are plotted on a map, it will outline the shape of that region. We used the following query to find the shape file:

By having the perimeter, or shape of the city, we are able to query for just the speed test data within the longitude and latitude points of the shape file. With this method, we calculated the average speeds for Baltimore City from the M-Lab data using the into query shown below:

Exploring Baltimore City’s Internet Speed Data in Relation to Maryland State
The most impactful way to look at this data set is by comparing Baltimore City’s speed test data with other areas throughout Maryland and exploring these comparisons at different moments in time. Due to constraints in processing time, we choose to calculate average speeds for the same 2-week period (May 3-16th) in 2019 and 2020. We also selected another week in 2020 (March 3-9th) to mark different times during the COVID-19 pandemic. The time in March being the transition from in-person to remote learning in Maryland and the point in May being around final’s week for college students. The point in May of 2019 serves as a ‘baseline’ or normal measurement of internet speeds.
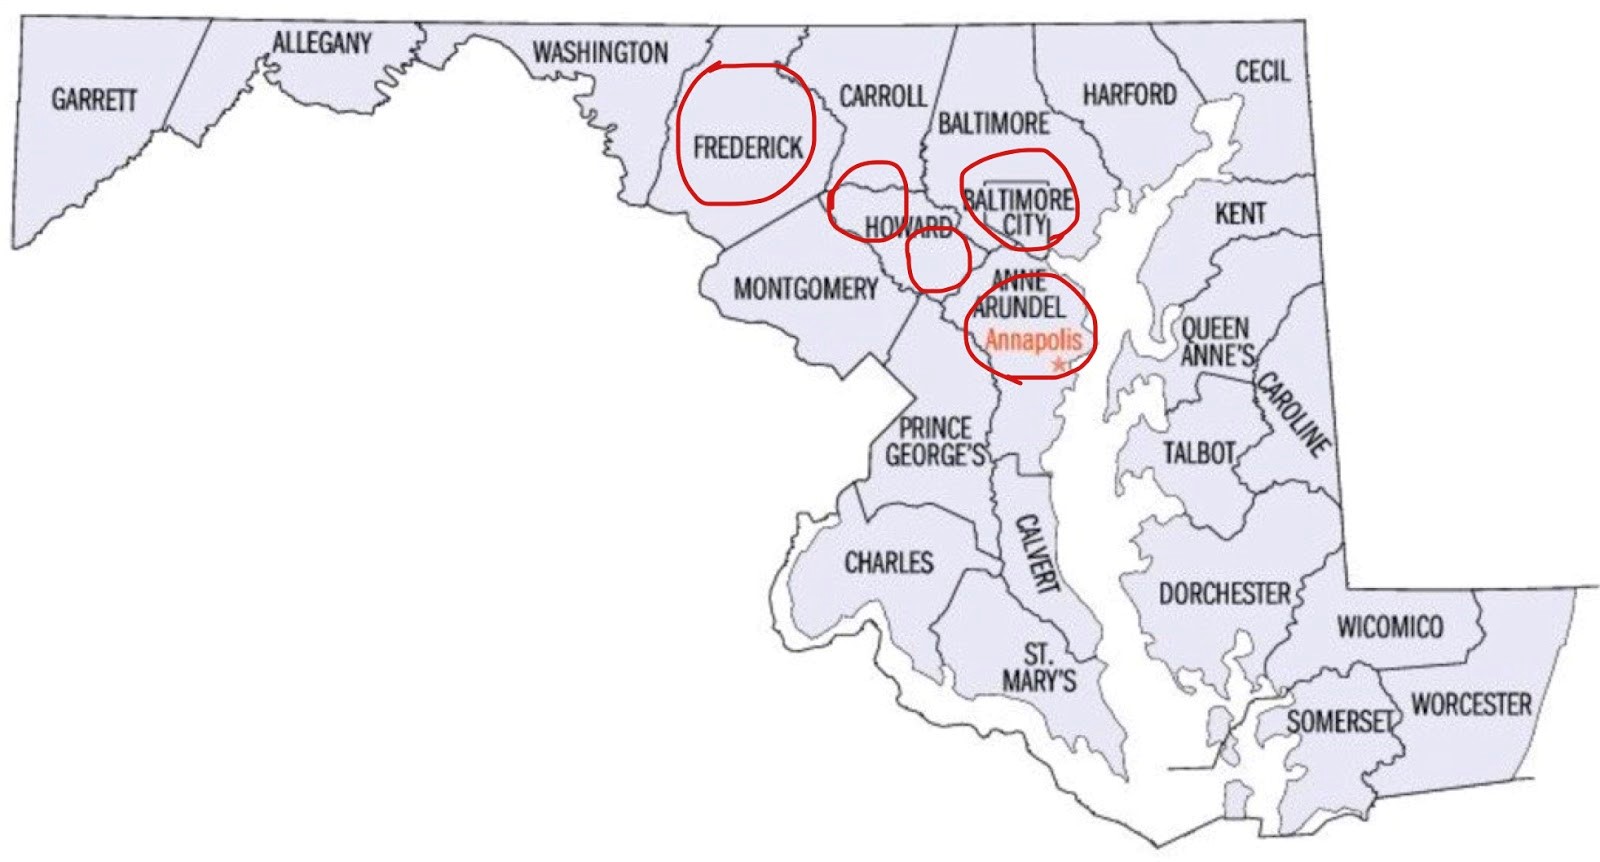
For selecting the areas to compare within Maryland, we took those with a consistently large sample size surrounding Baltimore City. These 4 other cities are Annapolis, Columbia, Ellicott City, and Frederick. We also compared these areas with the entire state as a whole.
Figure 1: Map of Maryland With the Areas Circled
To best visualize this comparison of download speeds among areas, we chose to represent the data as 3 separate bar graphs for each time point and then a line graph displaying these download speeds over time. We used the R-Studio’s ggplot2 package to aid in the process of creating these graphs Within this package, the data was cleaned and transformed into the following visualizations, making sure to leave attributes like color, labels, and axis ranges consistent between graphs to ensure the data is read properly.
Figure 2: May 2019 Average Internet Speeds
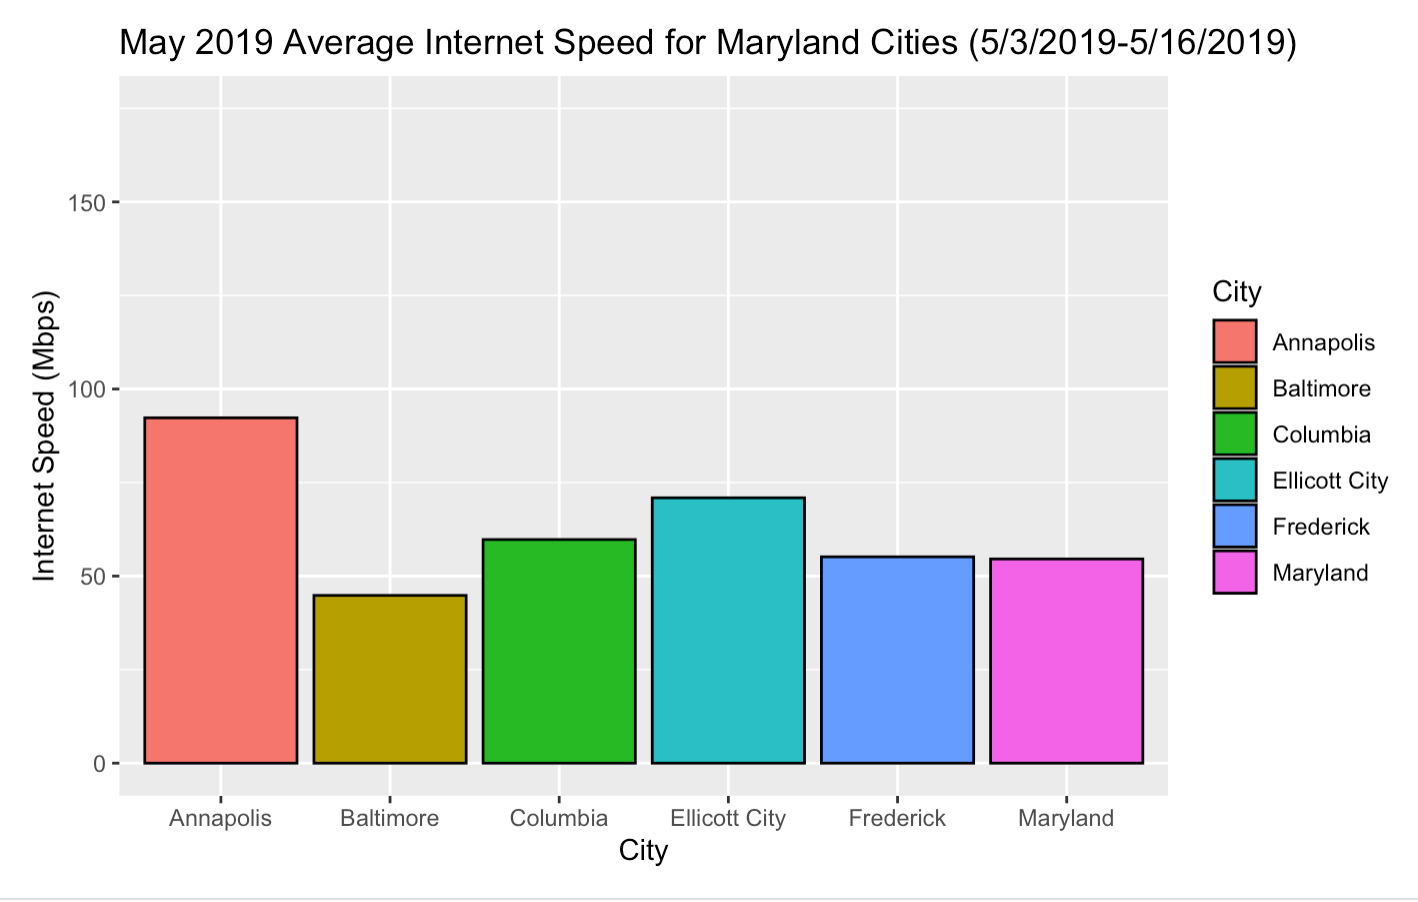
Figure 3: March 2020 Average Internet Speeds
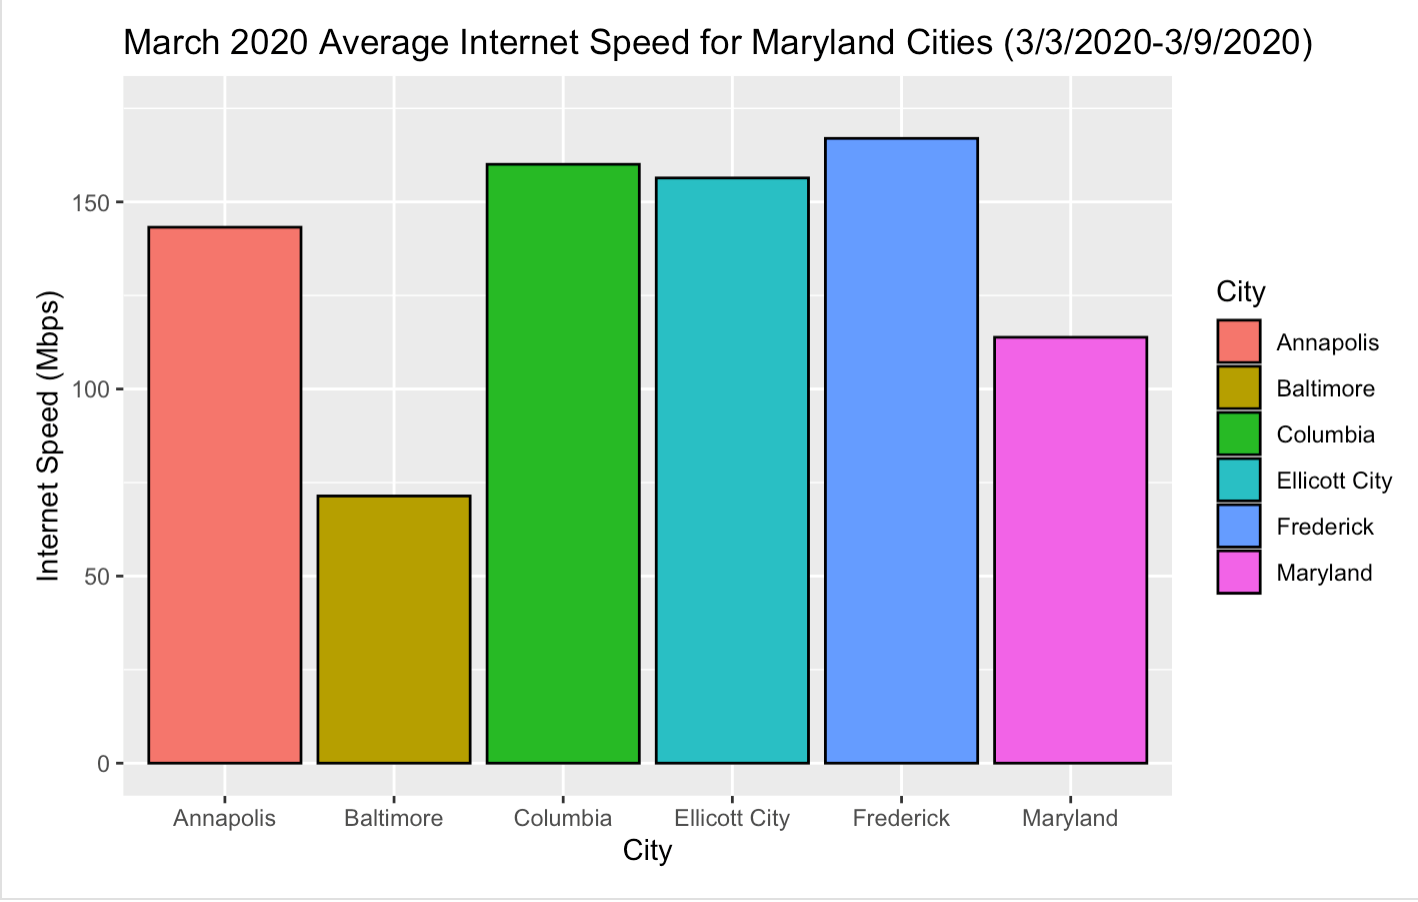
Figure 4: May 2020 Average Internet Speeds

Figure 5: Average Internet Speeds Over Time
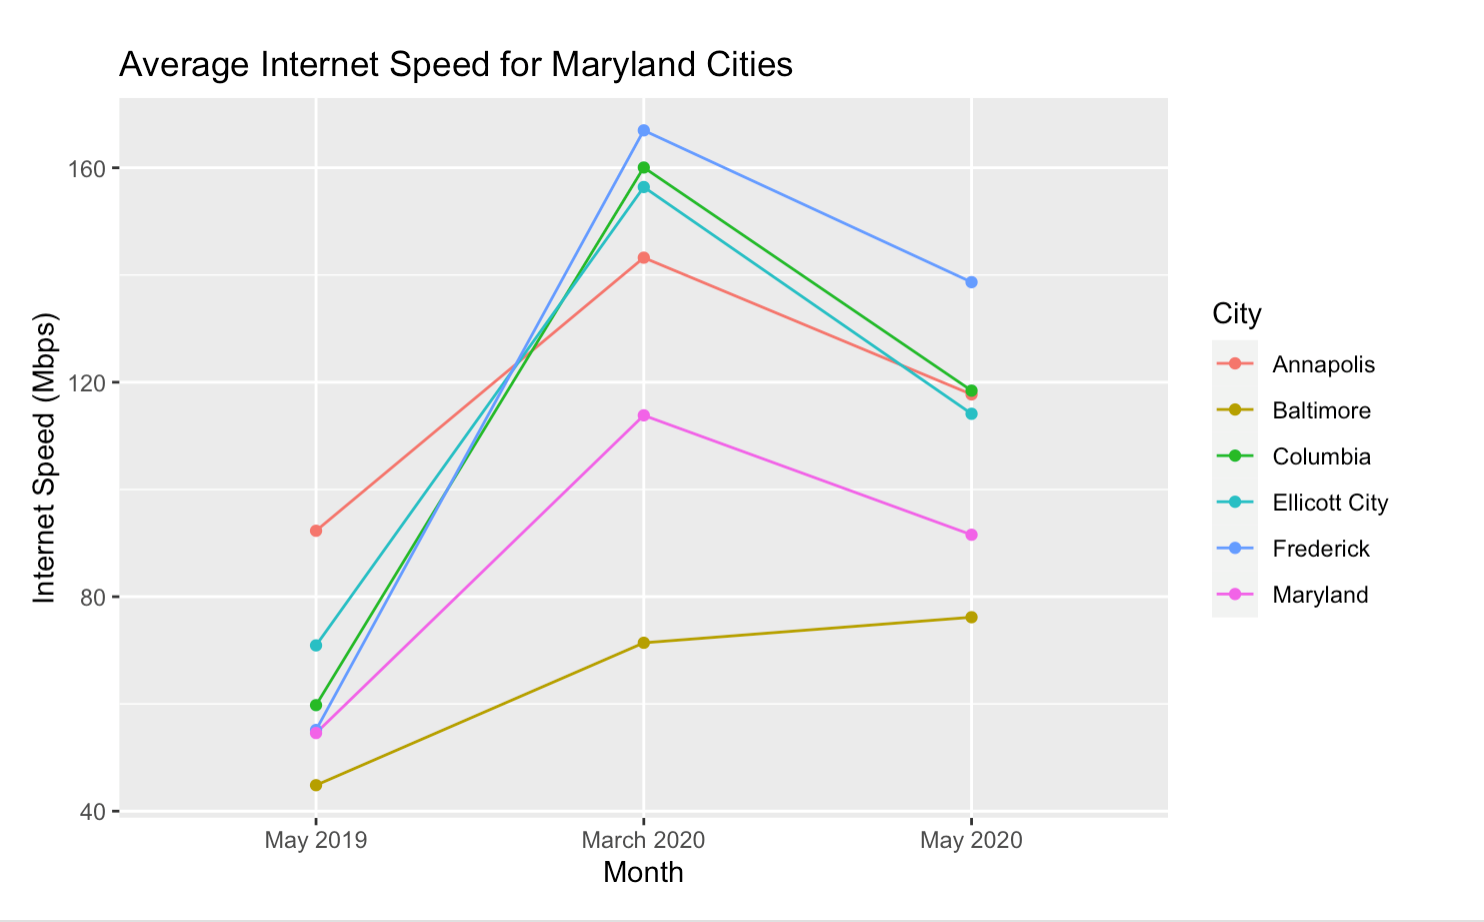
Findings: Is Baltimore City Getting Fast Enough Internet Speeds?
The speed test data extracted from M-Lab and visualized in these ways give light to glaring fact: The internet speeds in Baltimore city are consistently and significantly lower than the rest of Maryland. Using the benchmark of 25mbps as the established threshold for ‘fast enough’ download speeds, Baltimore City has an average of 45mbps in May 2019, 71mbps in March 2020, and 76mbps in May 2020. These speeds are in fact above 25mbps when viewing only the averages. However, if we explore the median download speed of each area, particularly Baltimore City (shown below), we see that 50% of Baltimore City was experiencing download speeds below 16mbps in May 2019, below 22mbps in March 2020, and below 26mbps in May 2020. So, although the average internet speeds for Baltimore City may indicate that speeds are ‘fast enough’, it may be more accurate to reference the internet speeds relative to the lower and upper 50% of residents.

What is interesting to note is that while the other major cities and the rest of Maryland experienced a large increase in the average internet speeds in March 2020 (during that transition from in-person to at-home activities), Baltimore City’s internet speeds did not increase during that time period as best seen in Figures 3 and 5. This indicates that Baltimore City’s internet was not ready to handle the sudden influx of internet users due to the pandemic.
More Data and Recourses on this Topic
Everyone has been made aware of the importance of internet access amid this Covid-19 pandemic. Given this importance, residents and leaders must measure internet speeds in our cities to shed light on inequities. This data clearly shows that Baltimore City is experiencing slower internet speeds compared to the rest of Maryland, but we could dig even deeper and ask the tough questions:
How does slower internet speeds correlate with median household income?
Do demographics of a region play a significant role in determining internet speed?
Are some household even getting access to internet at all?
Answering questions with data can help leaders advocate for improvements in not only internet speeds but in our access to work-from-home job opportunities and our children’s access to quality online education. We encourage everyone to further explore internet speed data in their community, city, and state.
Related Measurement Labs Blog Post
Links to more internet speed data sources:
Measurement Lab’s Open Source Internet Speed Test Raw Data
https://www.measurementlab.net/data/
Maryland Broadband Speed Tests (Measured in upload speeds)