
Redistricting data was just released hours ago by the US Census Bureau https://www.census.gov/programs-surveys/decennial-census/about/rdo/summary-files.html and the BNIA team is working quickly to look at how population changes have affected Baltimore’s communities over the past decade. Overall, Baltimore City experienced -5.7% population loss between 2010 and 2020 according to the latest data release. Our current population is 585,708 which is the lowest population in a century.
Nationally, the story of population change this past decade was a huge win for cities. For the first time in our history, all 10 of the most populous cities have more than 1 million people. Philadelphia experienced population increase of 5.1%, which is the largest growth since the 1950’s. Chicago grew by 1.9%, reversing its declining trend of the previous decade. And New York City grew by 7.7%. Unfortunately, for most counties with less than 50,000 people, population loss has devastated large parts of the country.
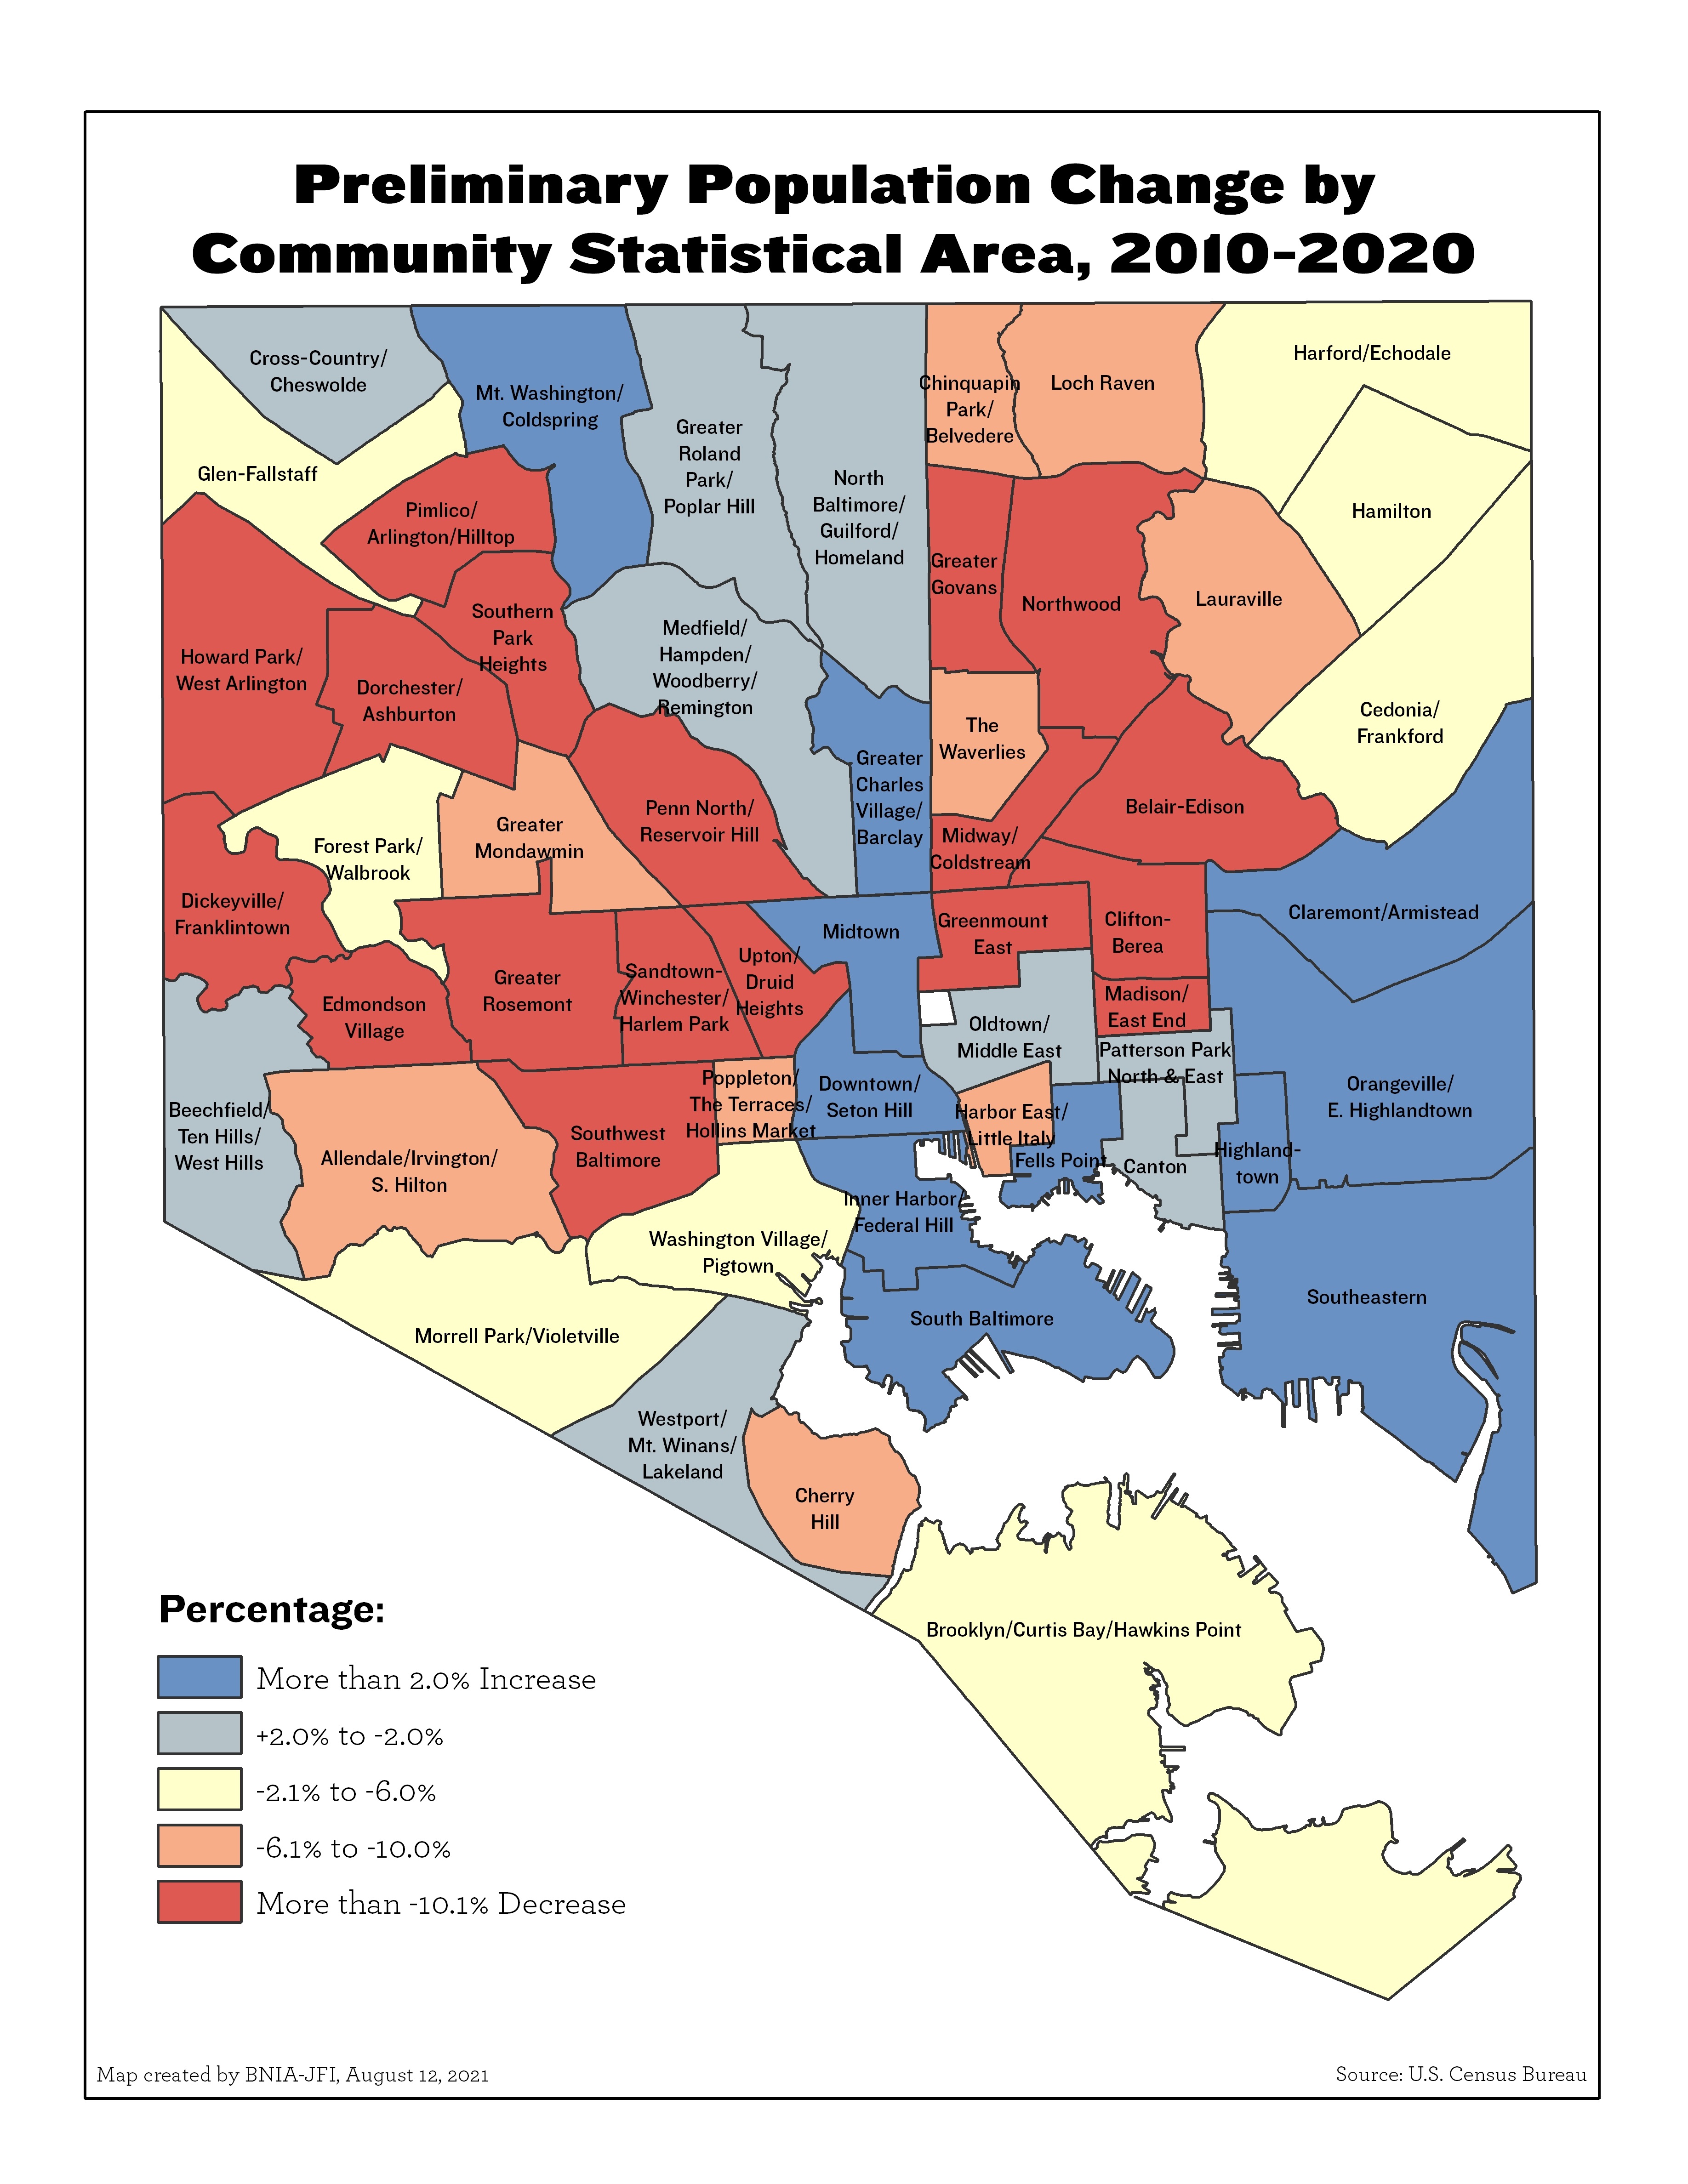
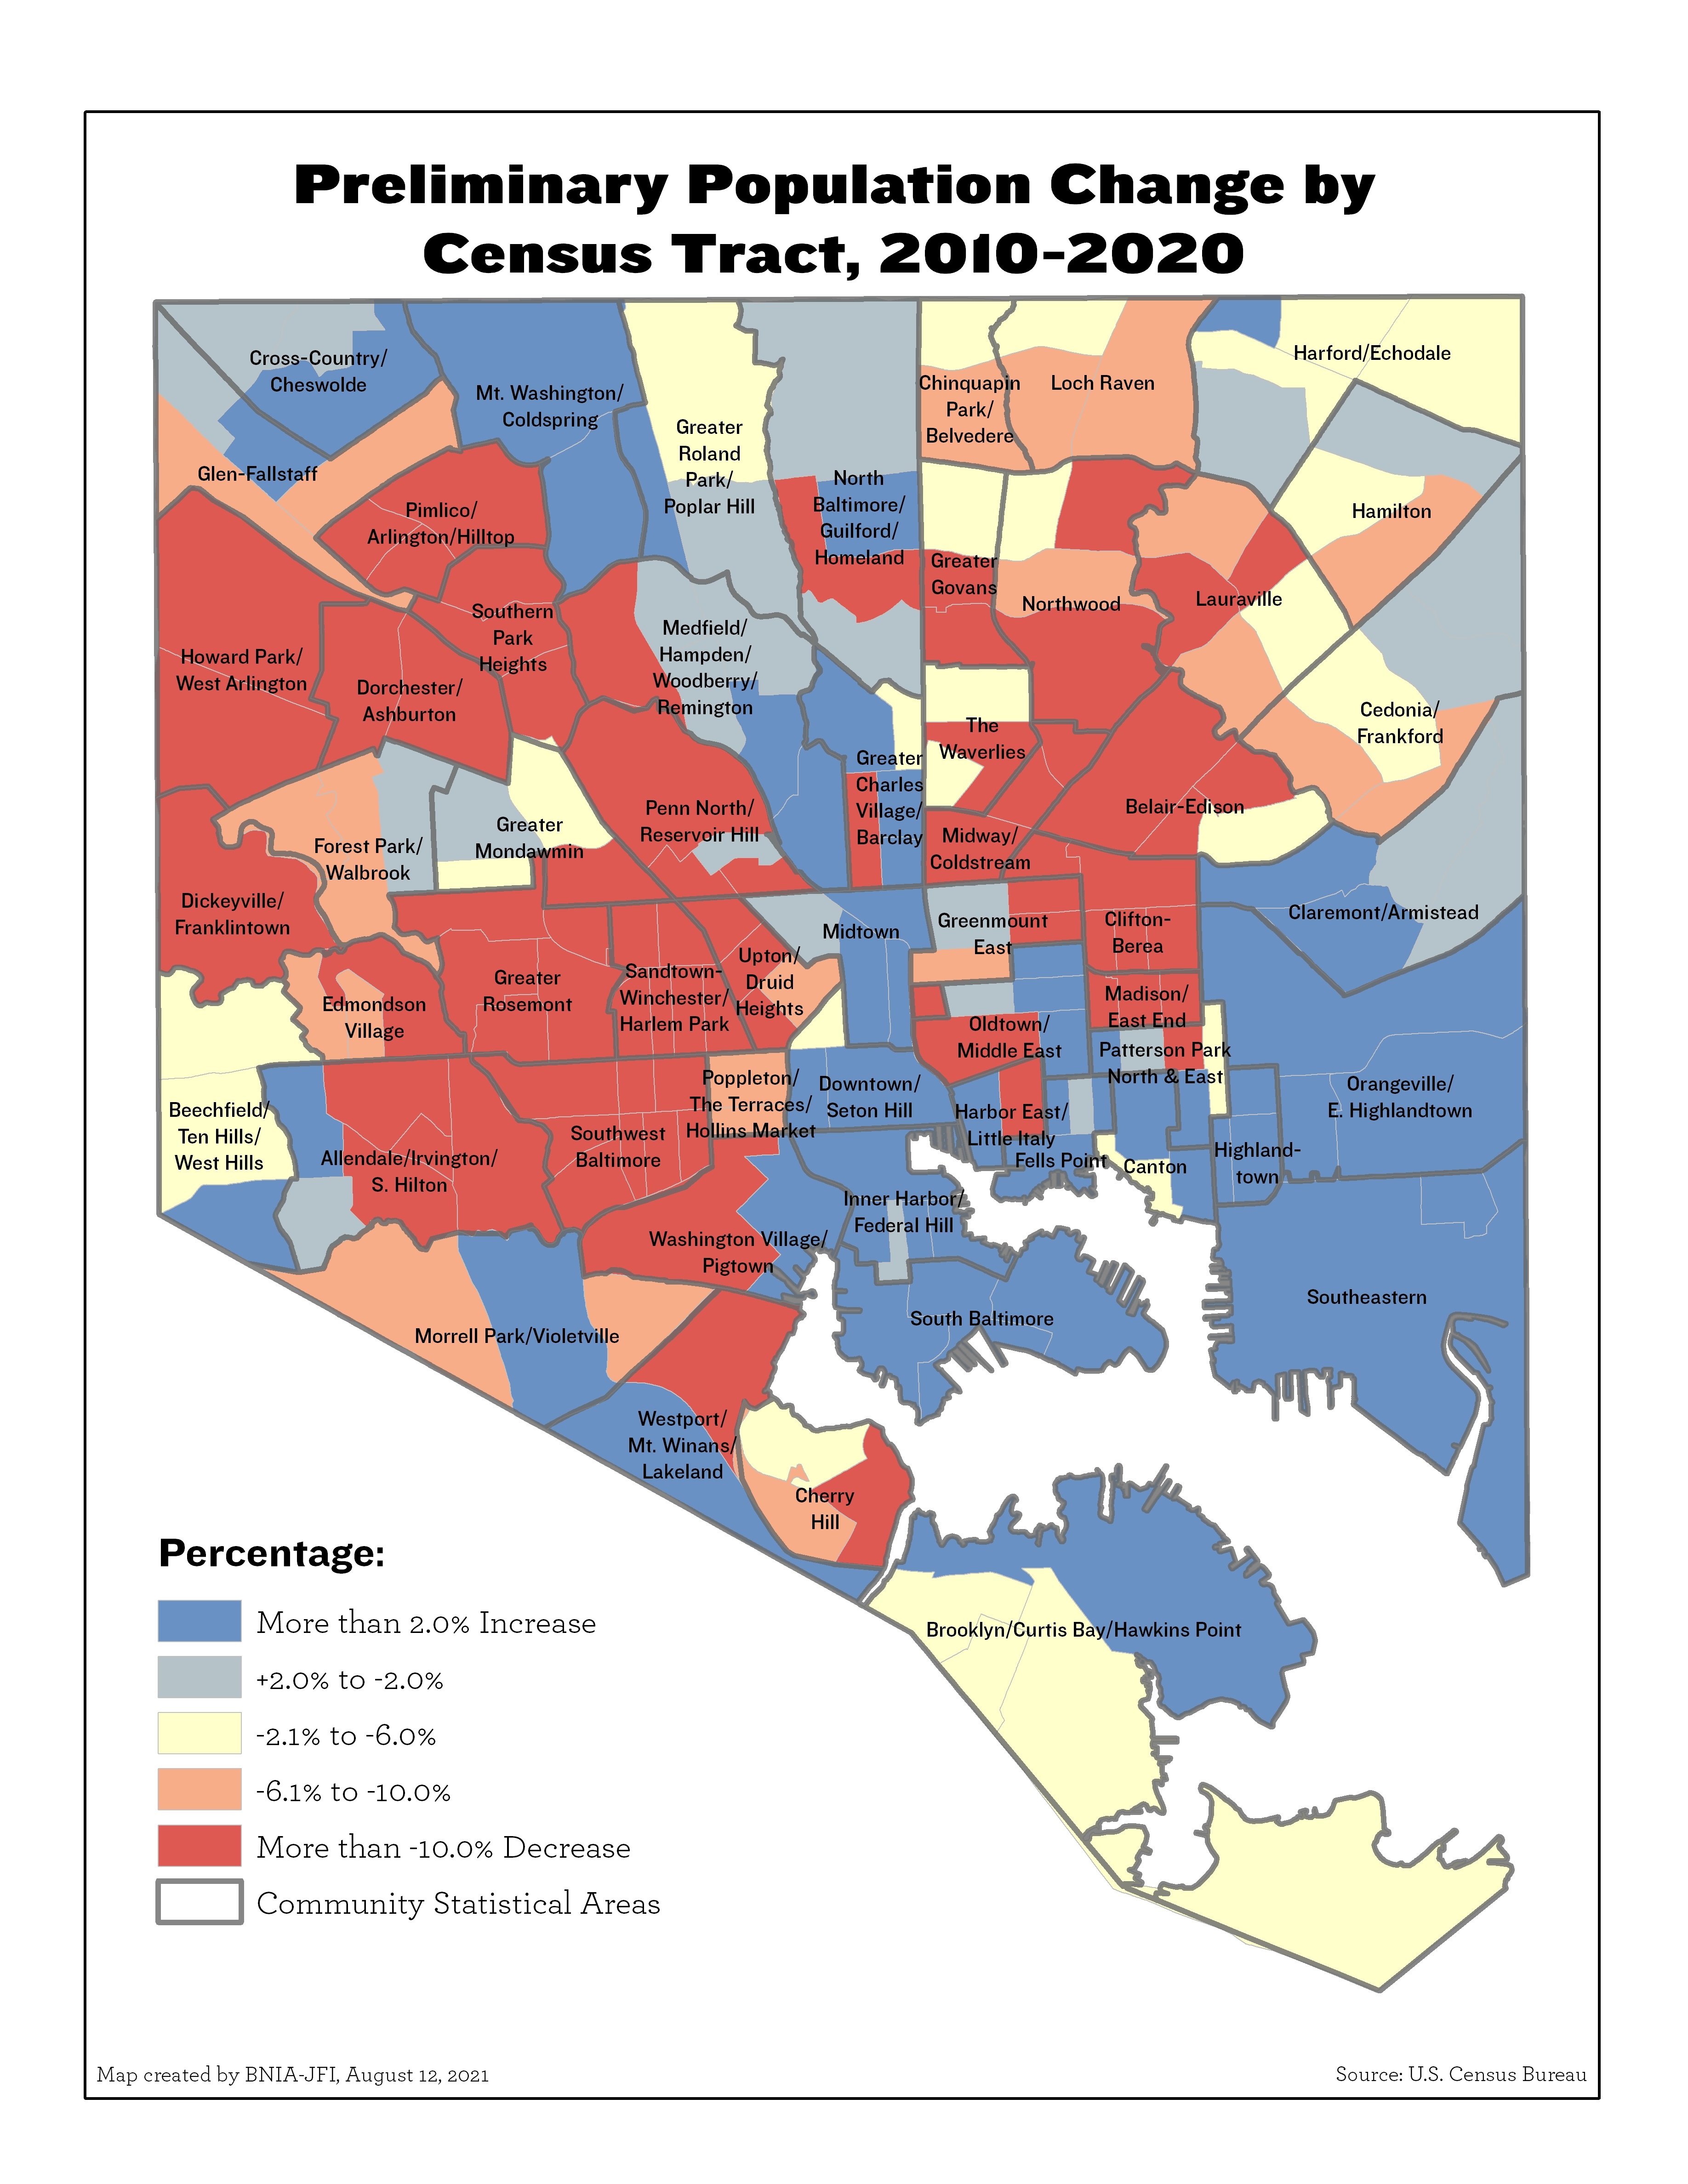
In Maryland, Baltimore was one of only 7 counties statewide to lose any population, and the only one along the I-95 corridor that connects the Baltimore region and Washington DC.
Interactive Map of Community Population Change
But as with almost everything, population does not affect every part of the city in the same way. Downtown/Seton Hill grew by 46.6% in the last decade and has nearly doubled its population since 2000 (see Table 1 below). Just minutes away from downtown, however, Sandtown-Winchester/Harlem Park lost -29.3% of its population in the same decade.
Table 1: Top 5 Communities in Baltimore in Terms of Percent Population Gain or Loss, 2010-2020
| Community Statistical Area | Population Total | % Change from 2010-2020 | ||
| 2000 | 2010 | 2020 | ||
| Downtown/Seton Hill | 4,767 | 6,446 | 9,448 | 46.6% |
| South Baltimore | 5,881 | 6,406 | 8,208 | 28.1% |
| Orangeville/East Highlandtown | 8,688 | 9,131 | 11,502 | 26.0% |
| Highlandtown | 6,722 | 7,250 | 8,820 | 21.7% |
| Fells Point | 8,569 | 9,039 | 10,638 | 17.7% |
| Madison/East End | 8,929 | 7,781 | 6,093 | -21.7% |
| Midway/Coldstream | 12,092 | 9,624 | 7,393 | -23.2% |
| Clifton-Berea | 12,496 | 9,874 | 7,577 | -23.3% |
| Southwest Baltimore | 20,965 | 17,885 | 13,189 | -26.3% |
| Sandtown-Winchester/Harlem Park | 17,495 | 14,896 | 10,531 | -29.3% |
 Why does Population Change Matter?
In a city that had been “built-out” by the 1950s in terms of its size and geographic boundaries, how many people move in or move out is at the root of many issues at the neighborhood level. Using this one measure (the change in total population at the neighborhood level over two points in time) can help everyone better understand the interconnected set of issues and experience residents, businesses, and other stakeholders are having.
In neighborhoods experiencing above-average growth, what policies does the city have in place to preserve affordable housing before housing prices rise? In declining neighborhoods, how can the quality of life be improved so that unoccupied homes can be inhabited and critical retail stores like food establishments or storefront banks choose to locate in the neighborhood?
For elected officials representing those districts, the constituencies in these varying geographies have different experiences based on the type of neighbor-hood they live in. Finding common ground across districts by these neighborhood experiences is critical to ensuring every community in Baltimore can continuously attract new residents and businesses.
Stay Tuned for More
Today’s Census data release marks just the beginning of analysis we will be doing to better understand what changed in Baltimore neighborhoods in the last decade. Stay connected with us to learn more and be a part of these neighborhood conversations. Sign up to receive our email notifications today https://bniajfi.org/stay-connected/